Fig. 4.

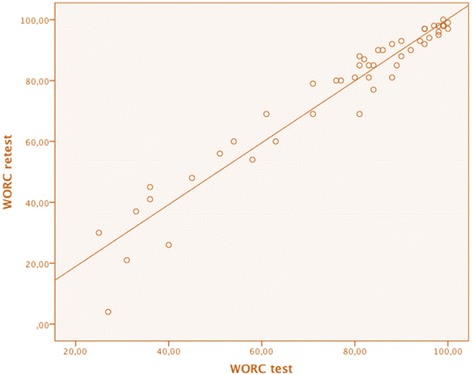
Scatter plot of WORC test vs. WORC retest. The individual results of the WORC test material plotted against the individual results of the WORC retest material (N = 49). Should be compared to Fig. 2

Scatter plot of WORC test vs. WORC retest. The individual results of the WORC test material plotted against the individual results of the WORC retest material (N = 49). Should be compared to Fig. 2