Fig. 2.

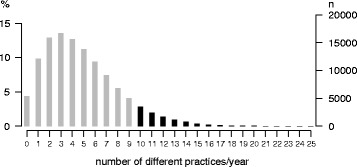
Distribution of the number of different practices contacted by the study population (n = 123.224) (number of persons with ≥ 10 contacted practices/year in black; cut at 25, maximum: 38 practices)

Distribution of the number of different practices contacted by the study population (n = 123.224) (number of persons with ≥ 10 contacted practices/year in black; cut at 25, maximum: 38 practices)