Fig. 5.

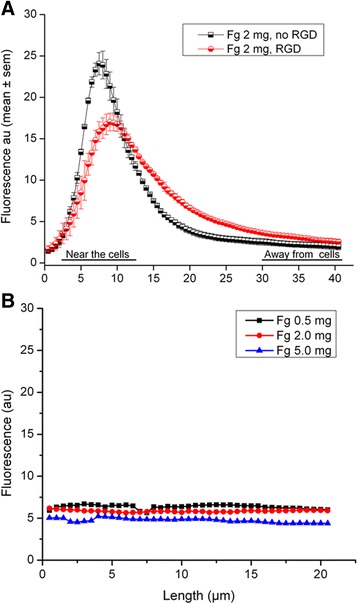
Representation of the changes of the mean fluorescence intensity according to the distance from the bottom of the dish up to 40 μm. a Without and with RGD at 2 mg/mL fibrinogen. b Without cells at 0.5, 2 and 5 mg/mL fibrinogen

Representation of the changes of the mean fluorescence intensity according to the distance from the bottom of the dish up to 40 μm. a Without and with RGD at 2 mg/mL fibrinogen. b Without cells at 0.5, 2 and 5 mg/mL fibrinogen