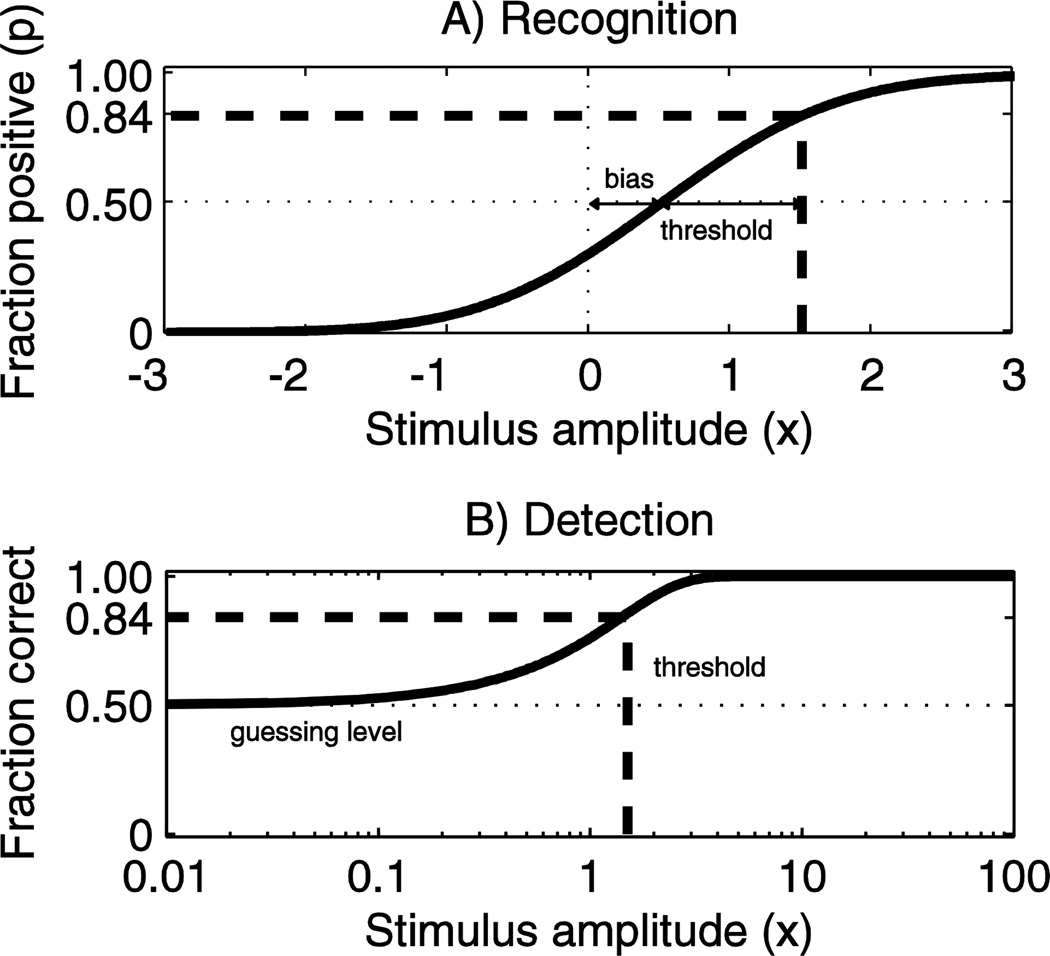
Figure 1.
A) An example of a psychometric function (solid line) with an underlying Gaussian distribution, a vestibular bias μ = +0.5 and threshold σ =1. The function corresponds to a bidirectional recognition task, which is common in vestibular and visual studies (e.g. task is to determine if motion is leftward or rightward). In this case a stimulus level of +1.5 (i.e. +1 relative to vestibular bias) corresponds to an average of 84% of responses being positive (dashed lines). B) For comparison, a typical psychometric curve for a 2-alternative force choice detection task is shown, with the threshold defined as the 75% correct level, as is typical.

