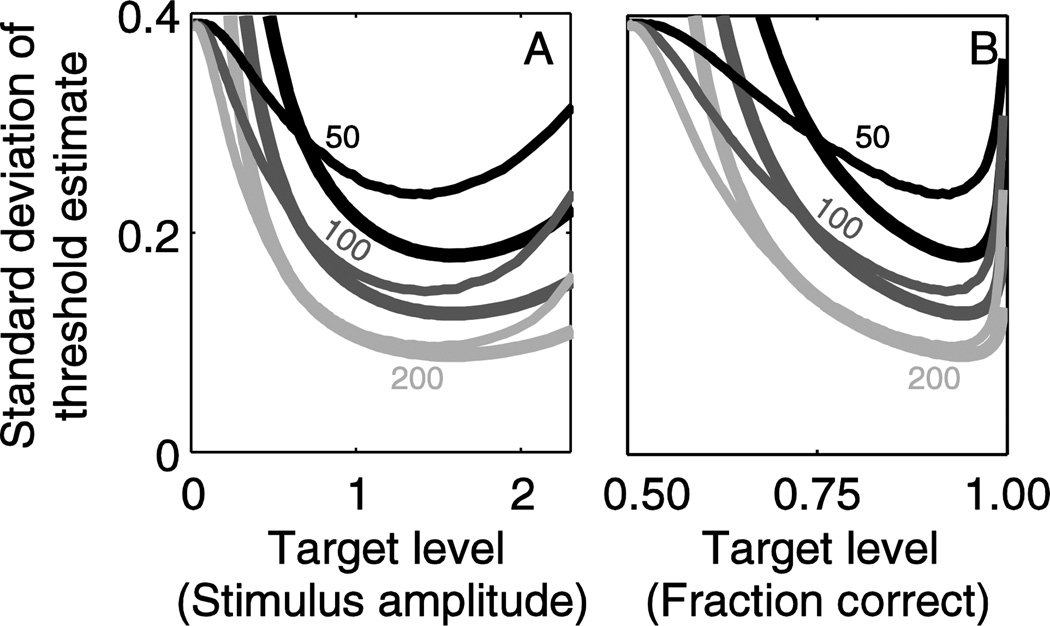
Figure 8.
MLE simulations (thin lines) compared to analytic results (thick lines). Results are shown for 50, 100 and 200 trials, with the same shade used for both results. With 50 trials, the MLE procedure is much less precise than theoretically possible, whereas with 200 trials it functions very close to the theoretical limit. The optimal target level is almost identical regardless of number of trials. Target level is presented in terms of stimulus amplitude (A) and fraction correct (B), as described above.

