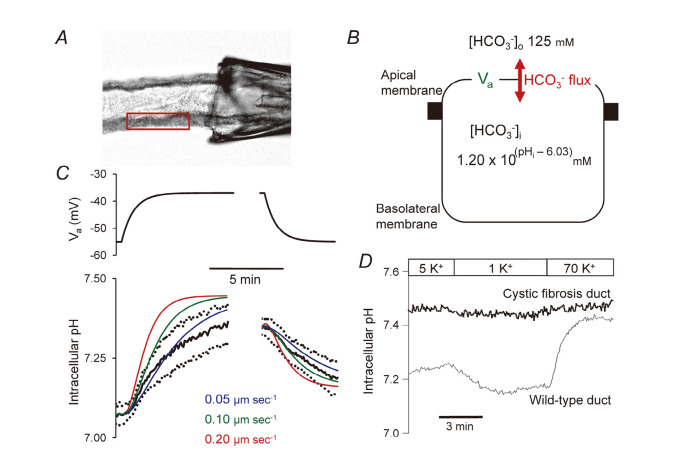
Fig. 6.
Estimation of the HCO3 – permeability of the apical membrane. (A) The lumen was microperfused, and cells were loaded with BCECF, pH-sensitive dye. A small region of the duct epithelium was selected for measurements of intracellular pH (pHi). (B) Since the pancreatic duct is a leaky epithelium (transepithelial potential is small), the potential difference of the apical membrane (Va) could be manipulated by changing the bath K+ concentration. HCO3 – flux across the basolateral membrane was inhibited by the anion transport inhibitor, H2DIDS (dihydro-4,4’-diisothiocyanatostilbene-2,2’-disulphonic acid). Voltage-driven fluxes of HCO3 – across the apical membrane were detected as changes in pHi. (C) Changes in pHi resulting from changes in Va. Theoretical curves based on 3 alternative apical HCO3 – permeability values were superimposed on averaged data (mean ± SEM). (D) HCO3 – fluxes across the apical membrane were abolished in pancreatic ducts isolated from a cystic fibrosis mouse model (∆F mouse) lacking in CFTR activity. Adapted from reference 27.

