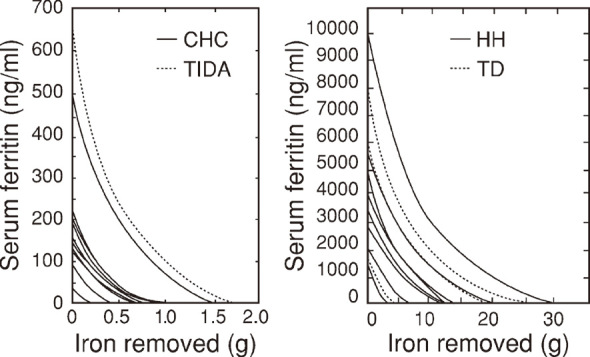
Fig. 3.

Curves obtained by computer simulation of the trend in serum ferritin decrease in patients with normal iron stores (Fig. 3a) and those with iron overload (Fig. 3b)
In Fig. 3a, solid curves indicate chronic hepatitis C (CHC) and dotted curve indicates treated iron deficiency anemia (TIDA).
In Fig. 3b, solid curves indicate hereditary hemochromatosis11-13) (HH) and dotted curves indicate transfusion-dependent anemia (TD).
