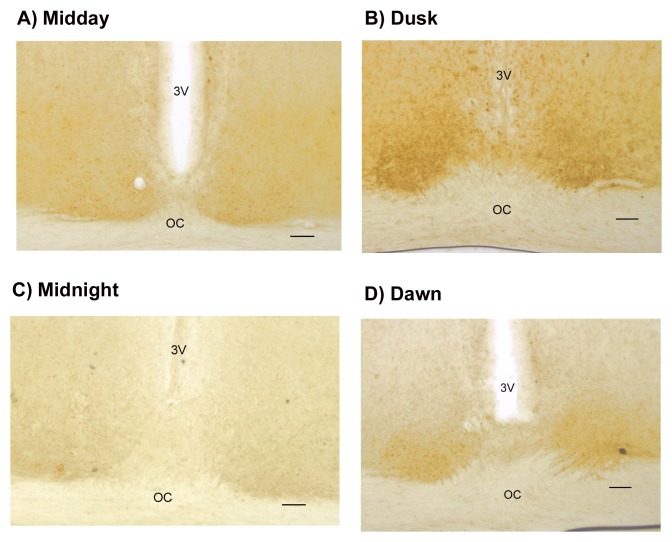
Fig. 3.
MT1 receptors localization in rat SCN across the circadian cycle. Labeling with MT1 antibody in the SCN is shown at A) midday ZT 5–7, B) dusk ZT 11–13, C) midnight ZT 23–01, and D) dawn ZT 17–19, respectively. 3V indicates the third ventricle, OC is the optic chiasm. Scale bar in each picture is 80 µm.

