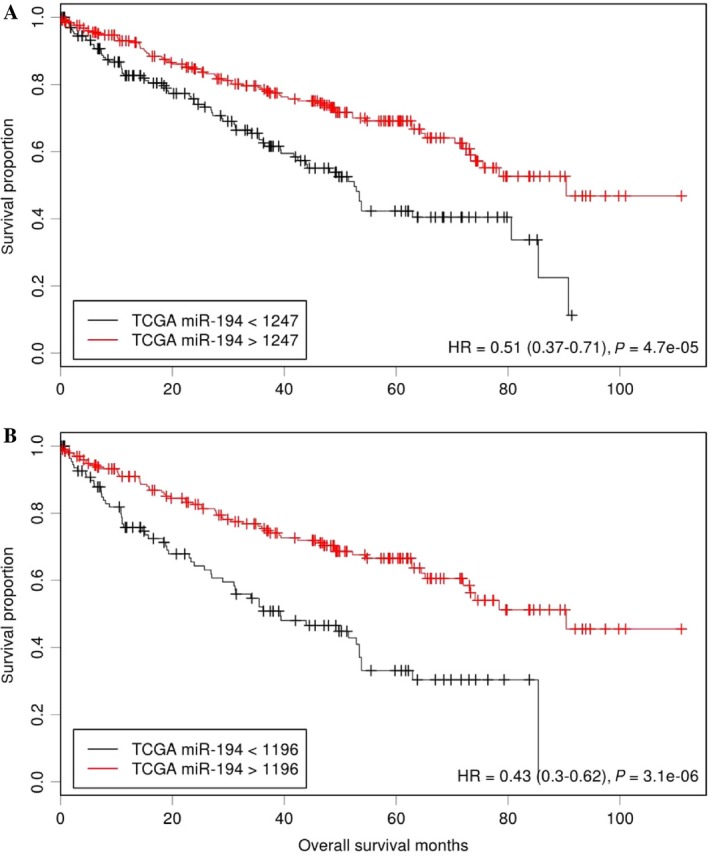
Figure 3.

Kaplan–Meier curves showing the association of miR‐194 expression and survival in The Cancer Genome Atlas (TCGA) data set. (A) Patients with tumors expressing higher levels of miR‐194had significantly higher overall survival compared to those with lower miR‐194 expression. (B) In tumors larger than 4 cm, Kaplan–Meier curves indicate that patients with higher levels of miR‐194had significantly higher overall survival.
