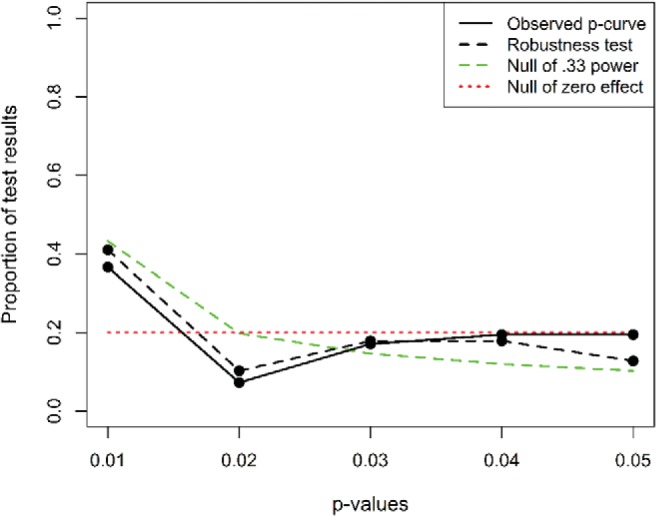
Figure 4.

The p-curve of the key statistical contrasts for the studies included in Figure 1 whose main text was accessible. The p-curve disclosure table is available at https://osf.io/928r3/. See the online article for the color version of this figure.
