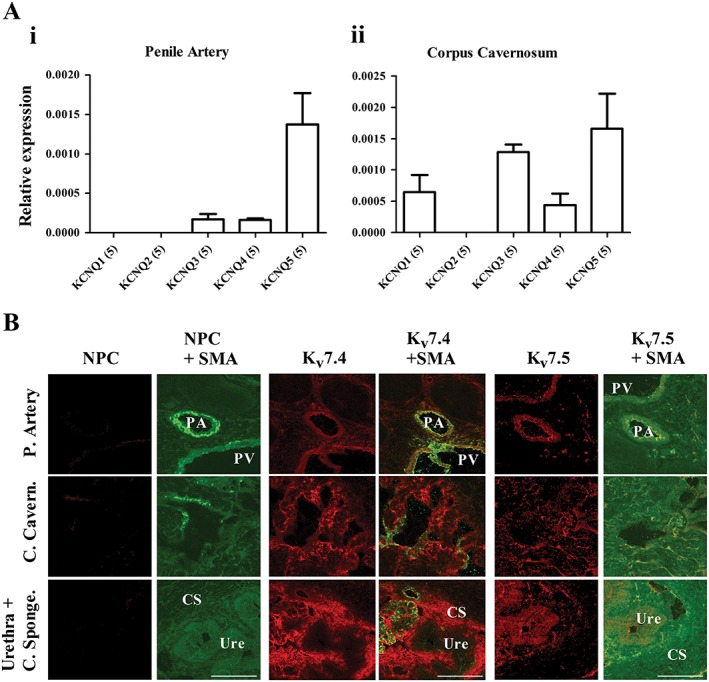
Figure 1.

(A) qPCR analysis of relative abundance of KCNQ genes in rat penile artery (i) and corpus cavernosum (ii) normalized to the mean of two reference genes. The relative abundance of each gene was calculated using the 2−ΔCq method. Data are mean ± SEM, and n is indicated in parentheses after each experimental group. (B) Representative fluorescence images from transverse sections (10 μm) of the penis, using primary antibodies against smooth muscle actin, Kv7.4, and Kv7.5 taken at ×10 magnification. Presence of protein was identified by the specific red staining in the case of the Kv7 antibodies and specific green staining for α‐smooth muscle actin (SMA) above respective controls. For the Kv7 antibodies, no primary controls (NPC) were performed. Scale bar represents 200 μm. CS, corpus spongiosum; PA, penile artery; PV, penile vein; Ure, Urethra.
