
Figure 7.
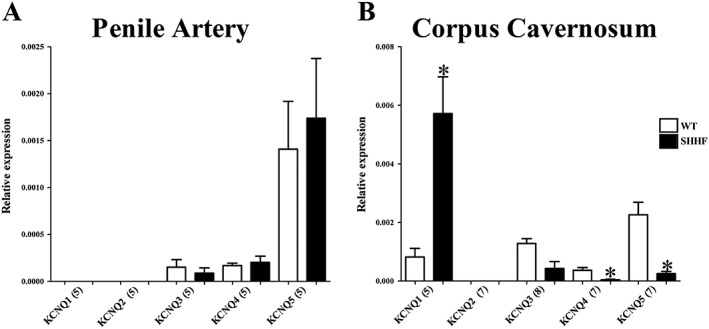
qPCR analysis comparing the relative abundance of KCNQ genes in penile arteries (A) and corpus cavernosum (B) of Wistar (WT) and SHHF rats. The relative abundance of each gene was calculated using the 2−ΔCq method. Data represent the mean ± SEM, and n is indicated in parentheses after each experimental group. Student's unpaired t‐test. *P < 0.05 from Wistar (WT).