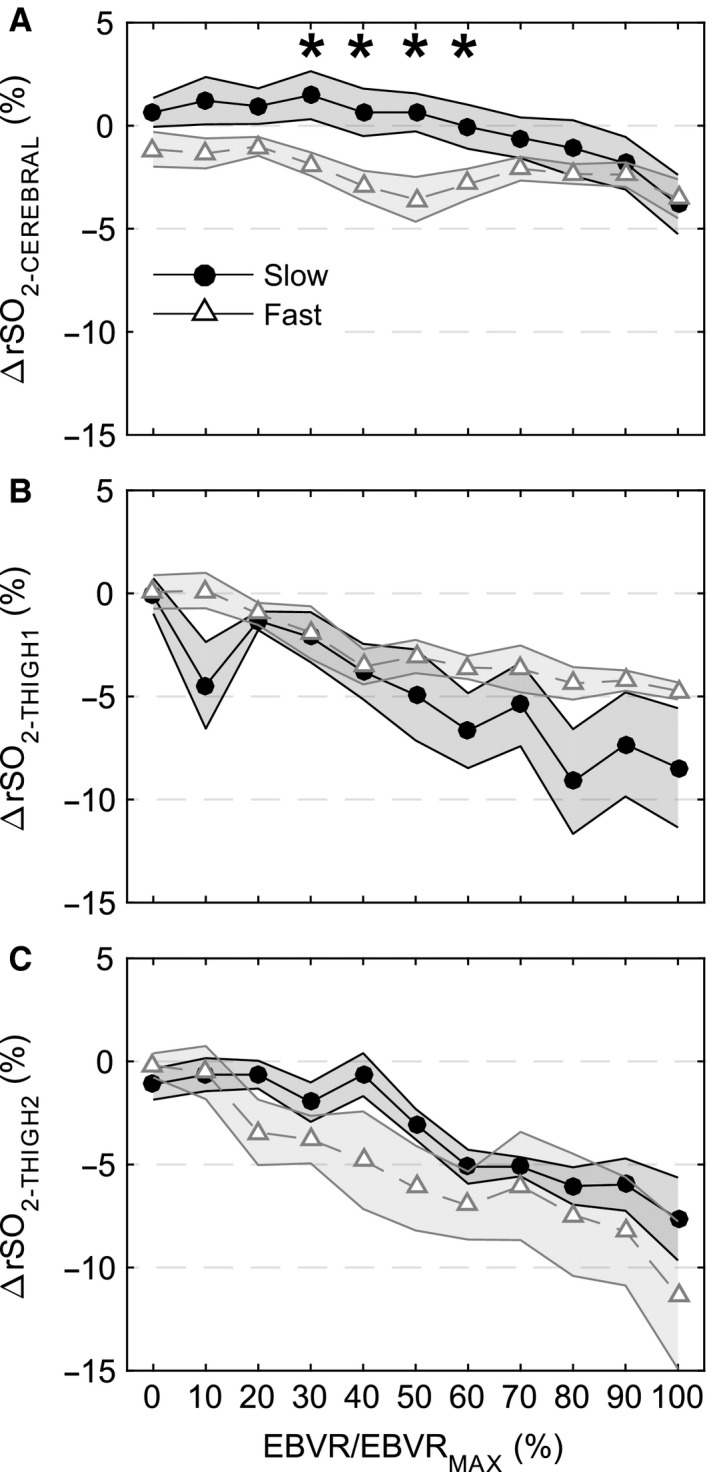
Figure 4.

Regional oximetry measurements with respect to baseline during hemorrhage plotted against EBVR/EBVRMAX. (A) rSO2‐ CEREBRAL (Slow N = 6, Fast N = 7), (B), rSO2‐ THIGH 1 (Slow N = 3, Fast N = 6), and (C) rSO2‐ THIGH 2 (Slow N = 3, Fast N = 4). Open gray triangles (fast hemorrhage rate) and solid black circles (slow hemorrhage rate) represent the mean and shaded regions standard error of the mean. * indicates significant difference between fast and slow hemorrhage rate at specified level of EBVR/EBVRMAX.
