
Figure 4.
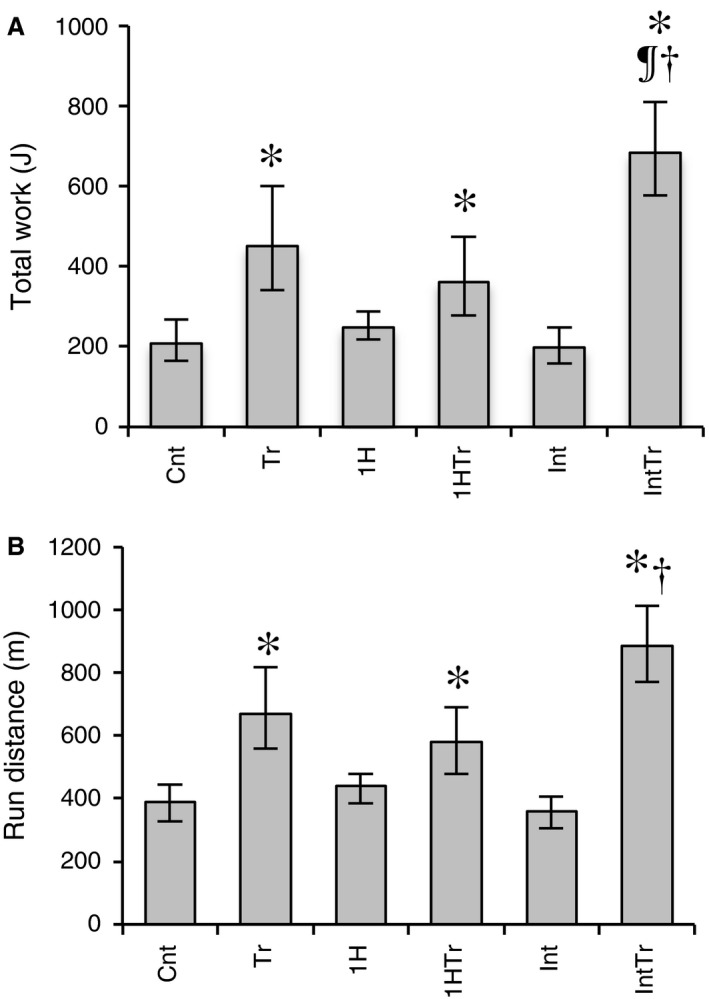
Total work capacity (A) and run distance (B) after 3 weeks of exercise training and/or hypoxic exposure. Values are represented as means ± SD. The number of mice was 12 per group. *, ¶, and †, significantly different from the Cnt, Tr, and 1HTr groups, respectively, at P < 0.05 using a one‐way ANOVA followed by Tukey's post hoc test and 95% confidential interval did not contain the parameter value specified in the null hypothesis.