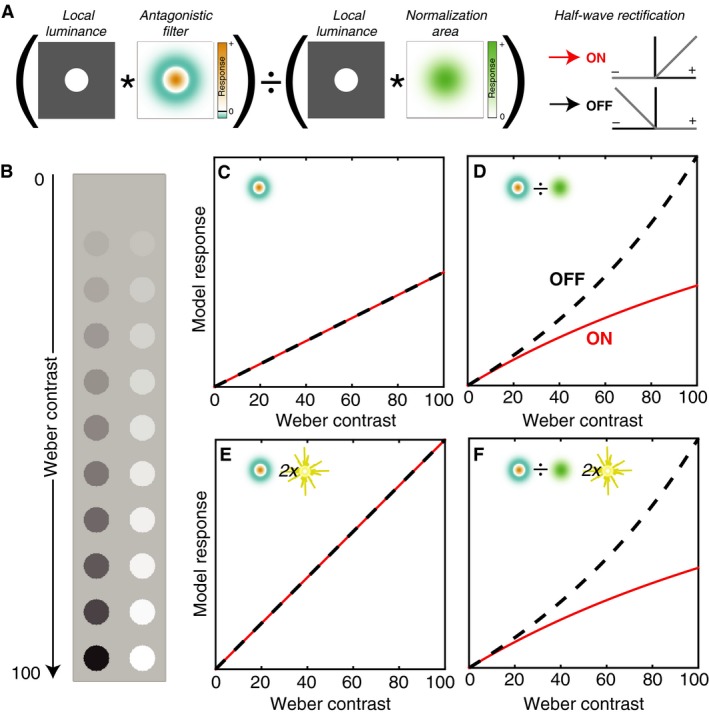
Figure 1.

Measuring luminance contrast. (A) In the model, an image is convolved (*) with both an antagonistic and a low‐pass filter. The antagonistic filter output is divided (normalized) by the low‐pass output. Half‐wave rectification is used to segregate bright (ON) and dark (OFF) responses without additional nonlinearities. (B) A disk in equal steps of Weber contrast from 0 to 100%, either decremental/dark (left) incremental/bright (right). (C, D) Predicted ON and OFF contrast response functions for the antagonistic stage alone (C) and the full model (D). (E, F) Response functions are shown as in (C, D), except the stimulus background level was increased by a factor of two. The ordinate scales are matched for C/E and D/F.
