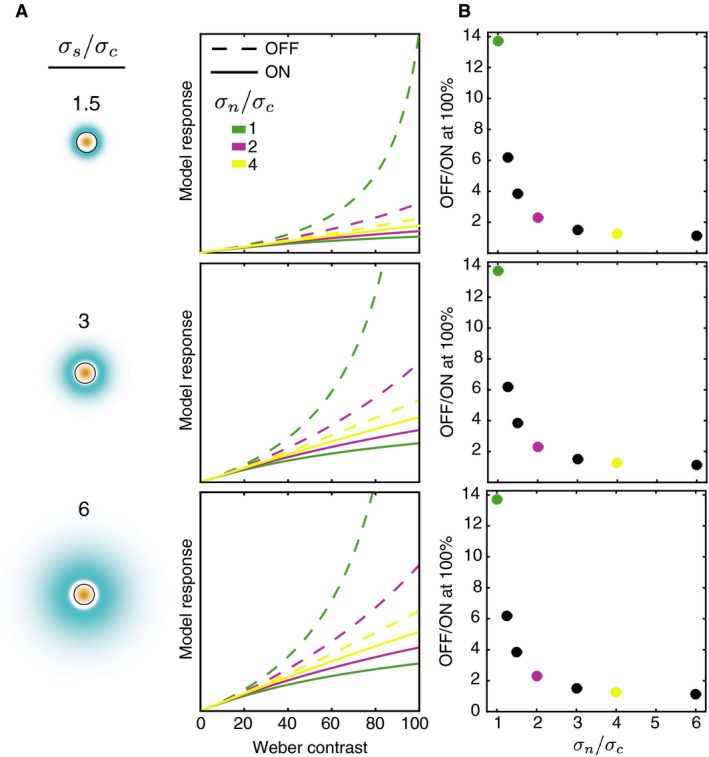
Figure 2.

Model contrast response functions. (A) Each panel shows the contrast response function for ON and OFF units (solid and dashed lines, respectively) with a different surround/center ratio (see icons on the left). For the icons, the color map is the same as in Figure 1, but the scale differs across panels so as to make the surround visible (with large surrounds, the filter response at each point in the surround is very small). The circle outline represents the area covered by the stimulus. Within each panel, the response functions are shown for three different normalization/center ratios. The ordinate scales are matched for all panels. (B) For each of the surround/center ratios in (A), the ratio of the model OFF to ON response at 100% contrast is shown. Each point shows the results for one normalization/center ratio (abscissa). Ratios for which full response functions are shown in (A) are color coded.
