
Figure 4.
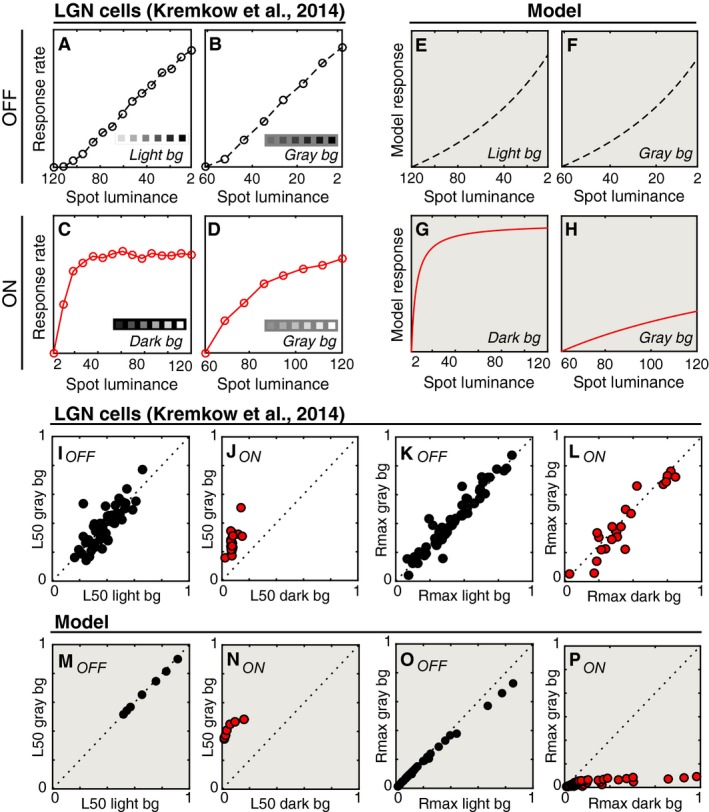
Comparison between lateral geniculate nucleus (LGN) cells and model units. (A–D) Firing rates (baselined) are shown for example OFF and ON LGN cells from Kremkow et al. (2014). The ordinate scale is the same for each panel. (A, B) show responses of an OFF cell with different luminance levels (cd/m2) on the abscissa. Note that the abscissa is reversed in these panels. (A) shows luminance responses on a light (120 cd/m2) background and (B) shows responses to a subset of the same luminances when presented on a gray (61 cd/m2) background (see insets). (C, D) are similar to (A, B), except firings rates are shown for an ON cell. In this case, the background luminance was either dark (C; 2 cd/m2) or gray (D; 61 cd/m2). (E–H) The responses of one example model unit are shown as in panels (A–D). (I, J) The relative luminance values at which individual LGN cells reached half of their maximum response on each background are shown as scatter plots for OFF (I) and ON units (J). (K, L) The normalized responses to the maximum contrast are shown as in panels (I, J). (M–P) Same as (I–L) except for the model population. For clarity, panels with model data have a shaded background.