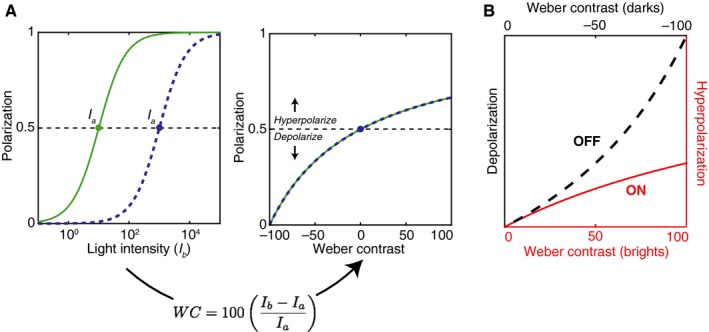
Figure 5.

Contrast asymmetry in cone polarization. (A) In the left panel, intensity response functions are shown for a model cone photoreceptor adapted to two different light intensities (I a). The horizontal dashed line represents the baseline polarization. In the right panel, the same data are plotted with the abscissa converted to Weber contrast. (B) Hyperpolarization and depolarization responses are overlaid to illustrate the different nonlinearities providing input to OFF bipolar cells for dark contrasts, and ON bipolar cells for bright contrasts.
