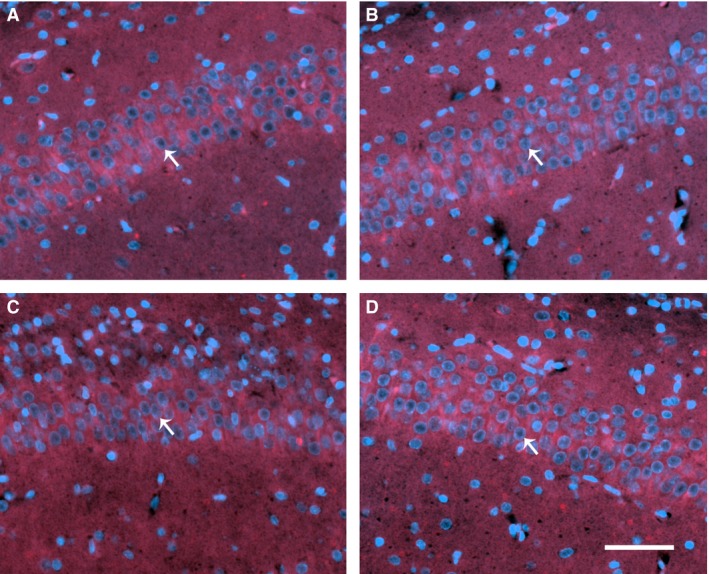
Figure 5.

Hippocampal immunohistochemistry. Representative CA1 hippocampal regions of interest from each hemisphere in the 21% oxygen group (A, B), and 100% oxygen group (C, D). The ligated hemisphere is shown on the left (A, C), with the unligated hemisphere on the right (B, D). Arrows show typical viable pyramidal neurons with large, round nuclei (DAPI, blue), and NeuN costaining (red). Scale bar (bottom right) represents 50 μm.
