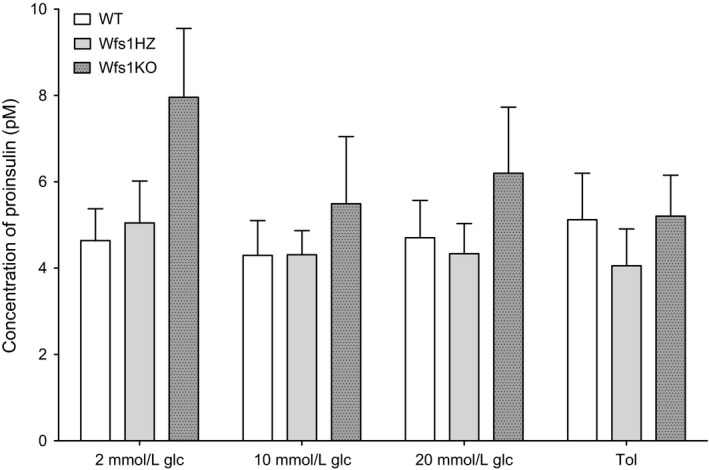
Figure 3.

Comparison of the average amount of proinsulin per islet between the genotypes. The proinsulin amount per islet was not significantly different between the genotypes (P > 0.05) after stimulation with 200 μmol/L tolbutamide (Tol) or various glucose (glc) solutions. Statistical analysis by two‐way ANOVA, where *P < 0.05, **P < 0.01 and ***P < 0.001. Data plotted as mean ± SEM, n = 6.
