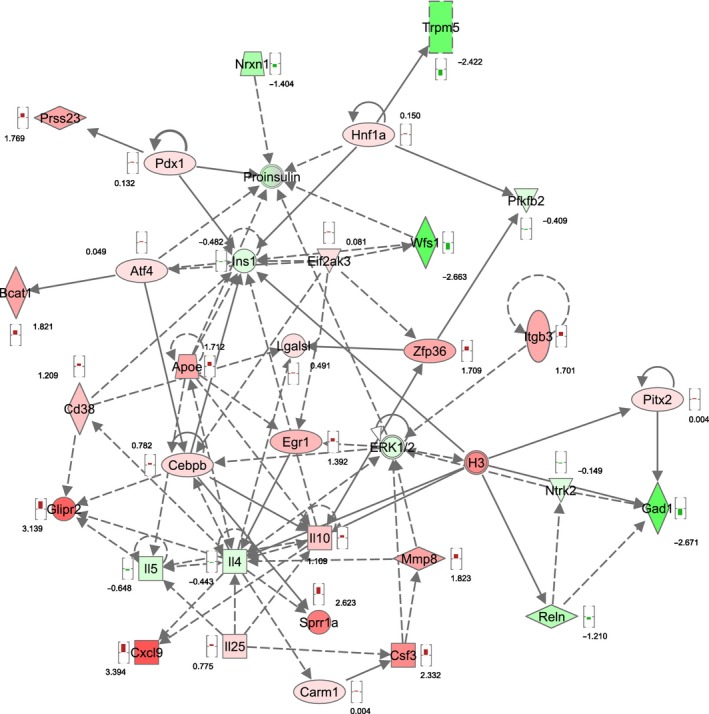
Figure 5.

Associated functional network of Wfs1KO compared to WT. Functional annotation revealed that genes with highest expressional changes because of WFS1 deficiency belong to the “tissue morphology, endocrine system development and function, molecular transport” functional network. Red symbols are upregulated genes, green symbols are downregulated genes, and the numbers reflect the t‐value of the statistical comparison with Bayesian moderated t‐test.
