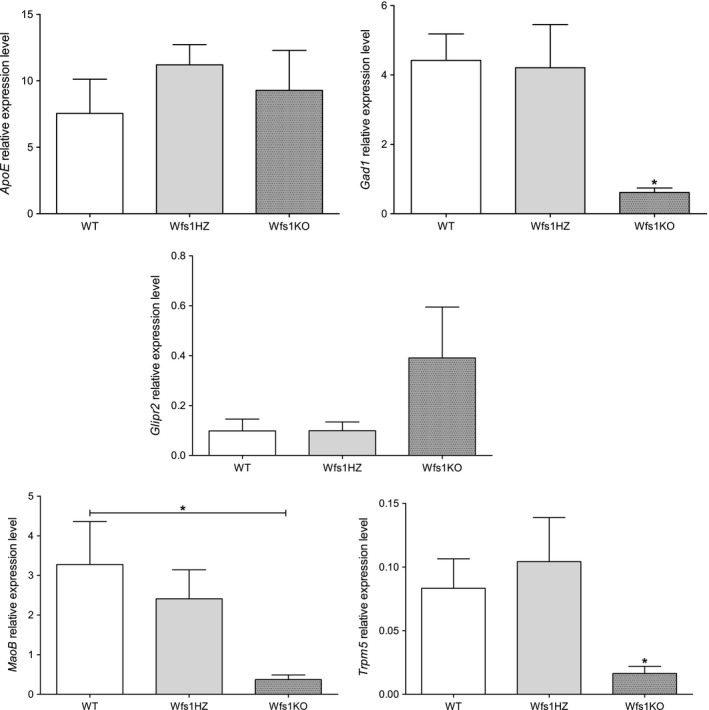
Figure 7.

Results of validating RT‐PCR. ApoE and Glipr2 were upregulated according to RNA‐seq, but RT‐PCR did not confirm it statistically, although there was a trend that ApoE and Glipr2 are upregulated in Wfs1KO islets. The downregulation of Gad1, MaoB, and Trpm5 was confirmed in Wfs1KO islets. Statistical analysis by one‐way ANOVA followed by Tukey post hoc test, where *P < 0.05, **P < 0.01 and ***P < 0.001. Data plotted as mean ± SEM, n = 4.
