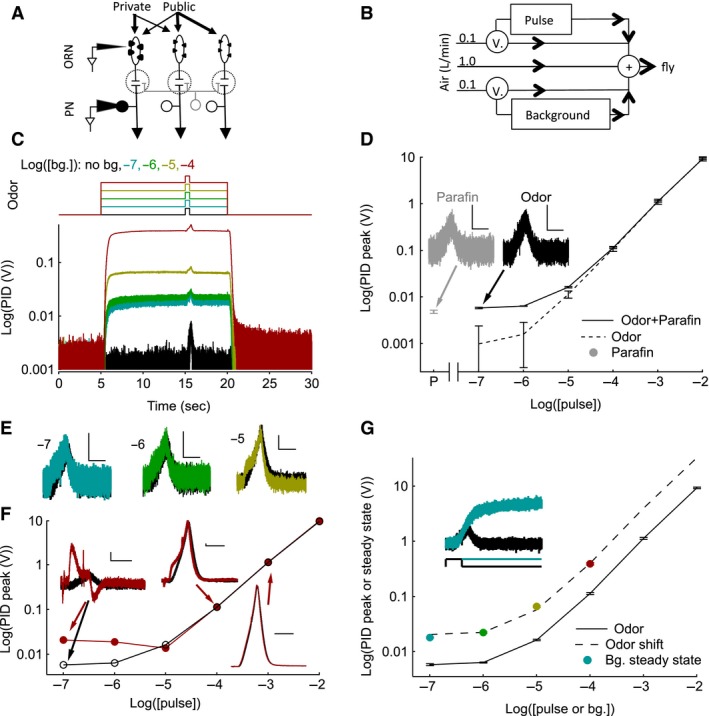
Figure 1.

Odor stimulation and measurement of stimulus using photoionization detector (PID). (A) Private odor predominately activates ORNs presynaptic to VM7 PNs and thus minimizes lateral interactions; and a public odor activates multiple ORN classes. (B) Schematic illustrating the air flow pathway and valves (V.) used to control the odor stimuli. (C) The average (N = 10 trials) PID responses (bottom trace) to 2‐butanone odor stimulus protocols used (top trace) to measure neural activity. Each trace shows the response to background and pulse odor at the same concentration (10−7 pulse on 10−7 background etc.). D‐F, Quantification of the pulse stimulus. The response of the PID to background odor is subtracted. (D) The average pulse response of the PID without (solid) or with the paraffin oil response subtracted (dashed lines) is plotted as a function of pulse odor concentration. At low odor concentrations, the PID response is dominated by the solvent, paraffin oil. Within margins of error, the PID responses are linearly related to the odor concentration. “P” on the X‐axis is paraffin oil alone. Error bars indicate Standard error of the means (SEMs). Gray point, indicates the PID response to the paraffin oil pulse alone. Inset, shows that the paraffin oil PID response (gray) is similar to the response to 2‐butanone at 10−7 concentration, which includes responses due to both paraffin oil and odor (black). Scale bars are 5 mV, 500 msec. (E) The PID pulse response as a function of time in the presence of background odor (colored) and its absence (black) shows that PID responses are similar with and without background. Background and pulse odor intensity are the same and listed to the left of each trace. Scale bars are 5 mV, 500 msec. F, The average peak PID pulse response during the highest background odor stimulus (10−4; red points and line) and in its absence (black circles). Insets show the PID pulse responses as a function of time in the presence (red) and absence (black) of the odor background for a select set of responses. Scale bars are 5 mV, 500 msec. G, The average peak PID pulse response in the absence of a background stimulus (black points and solid curve) and the steady‐state PID voltage during the background of the same odor concentration. The dashed line is a shifted version of the PID pulse peak curve obtained by multiplying a single scale factor (~4) chosen to match the PID steady‐state response. The pulse and background concentrations are, therefore, related to each other by a single scale factor. The inset shows the PID pulse response (black) at 10−7 concentration and the PID response during the background stimulus of the same intensity (blue).
