Figure 2.

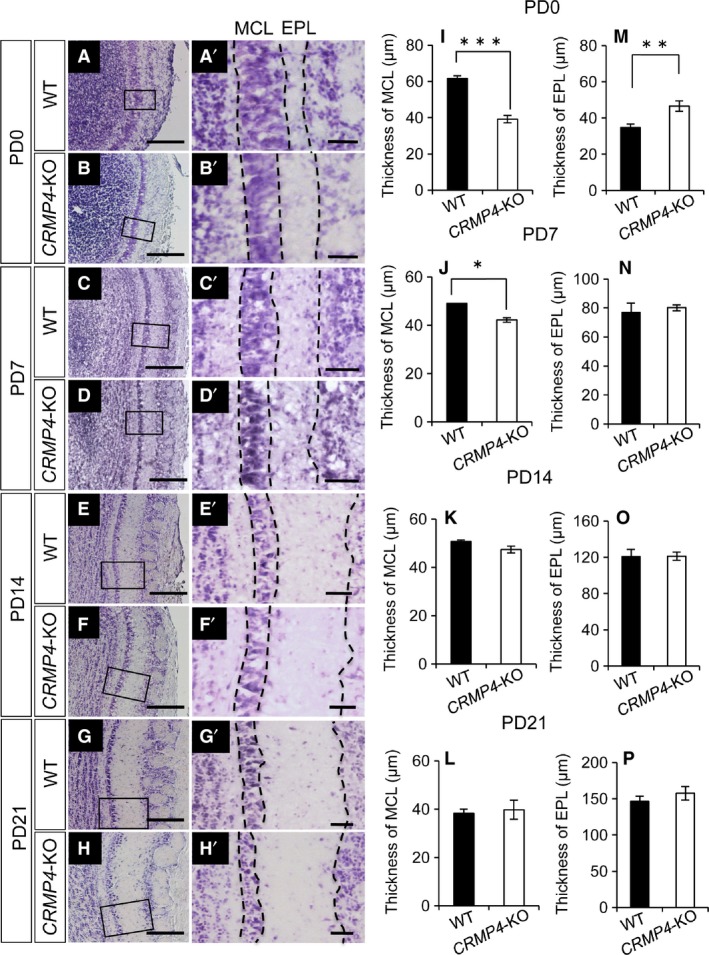
Morphometric analysis of layer thickness in the OB of WT and CRMP4‐KO mice at postnatal day (PD) 0 to PD21. (A‐H) Representative images of Nissl‐stained OB sections of WT (A,C,E,G) and CRMP4‐KO mice (B,D,F,H). (A′‐H′) Higher magnification of boxed areas in A–H. (I‐L) Graphs showing the thickness of the mitral cell layer (MCL) at PD0 (I), PD7 (J), PD14 (K), and PD21 (L). (M‐P) Graphs showing the thickness of the external plexiform layer (EPL) at PD0 (M), PD7 (N), PD14 (O), and PD21 (P). All results are expressed as the mean ± SE. Student's t‐test was performed to compare the means, *P < 0.05, **P < 0.01 and ***P < 0.001. Scale bars: 100 μm (A‐H), 20 μm (A′‐H′).
