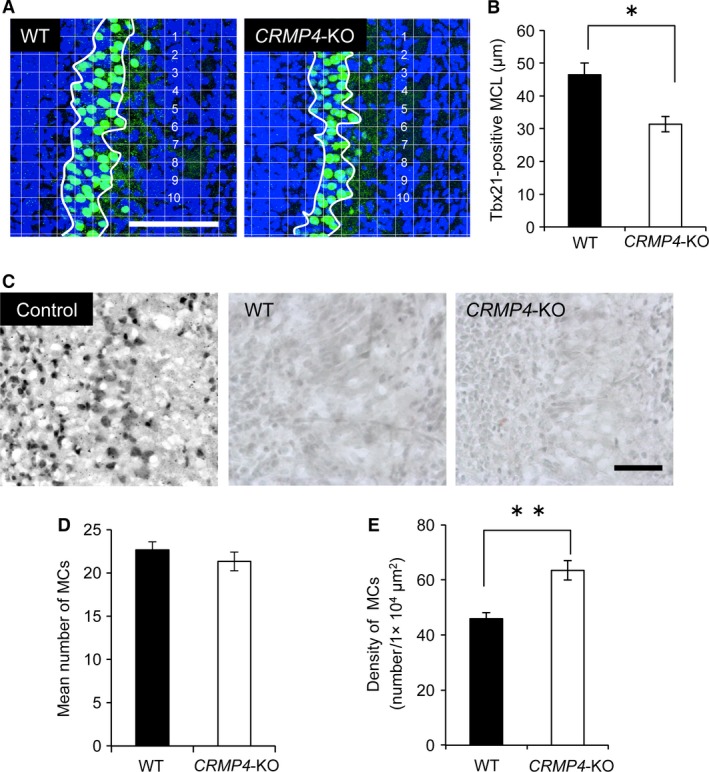
Figure 3.

Morphometric analysis of mitral cell layer (MCL) thickness and mitral cell (MC) number in WT and CRMP4‐KO mice at PD0. (A) Representative micrographs showing Tbx21‐positive nuclei in the olfactory bulb (OB; green). Nuclei were stained with Höechst 33 258 (blue). Appropriate grids (20 × 20 μm) were applied to the images, and average thickness of the MCL was calculated from the measurement at 10 grid lines that crossed the layer. (B) Bar graph shows that at PD0 the thickness of the MCL in CRMP4‐KO mice was significantly decreased compared with WT mice. (C) Detection of apoptotic cells in the OB. TUNEL‐positive cells are observed in sections treated with DNase (Control) but sections through the OB of WT and CRMP4‐KO at PD0 did not show apoptotic cells. (D) Bar graph showing that the mean number of MCs in CRMP4‐KO mice was not significantly different from that in WT mice. (E) Bar graph showing that density of MCs in CRMP4‐KO neonates was significantly higher than in WT mice. Bars indicate mean ± SE. Student's t‐test was performed to compare the means, *P < 0.05 and **P < 0.01. Scale bars: 100 μm (A), 50 μm (C).
