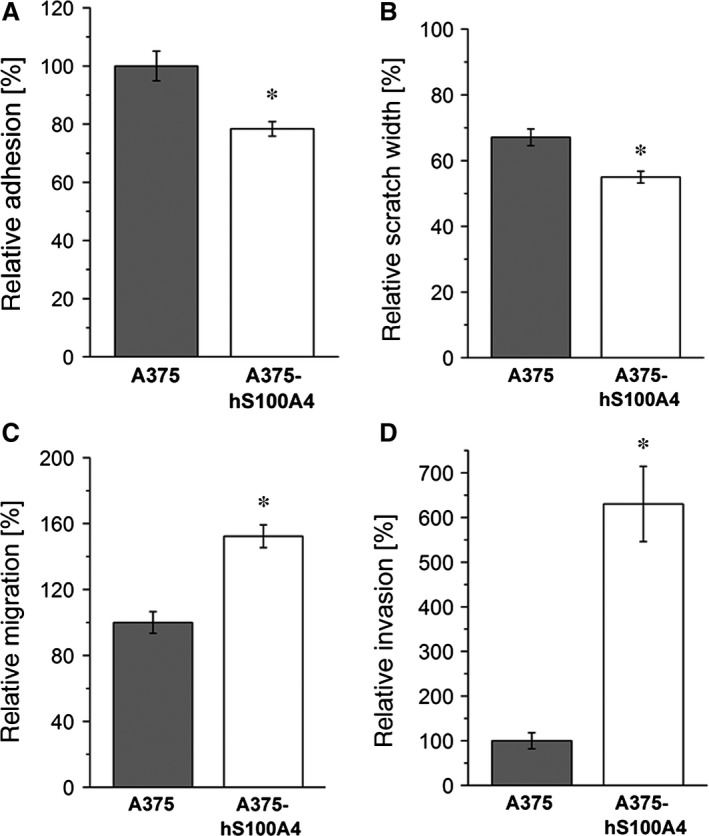
Figure 6.

Effect of S100A4 overexpression on cell adhesion, motility, migration, and invasion in A375 cells. Relative adhesion (A), relative scratch widths (B), relative migration (C), or relative invasive capability (D) of A375 and A375‐hS100A4 cells was measured after 24 hrs. Adhesion, migration, and invasion rate of untreated control cells were set as 100%. Initial scratch width was set as 100% (mean ± S.E.M., n = 3, *P < 0.05, versus A375 cells).
