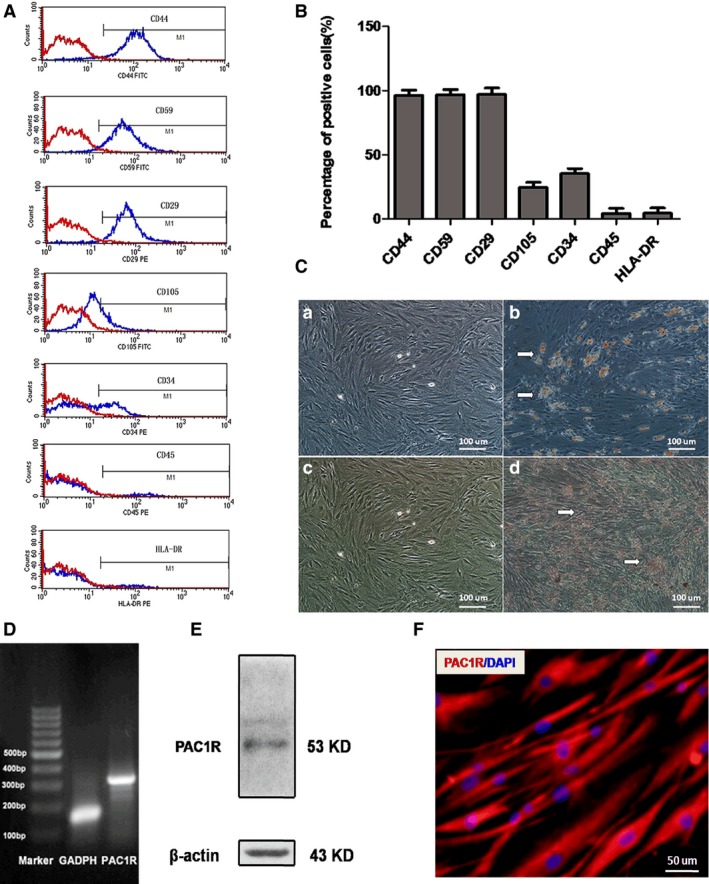
Figure 2.

hADSC identification and PAC1R expression in hADSCs. (A) Flow cytometry analysis of surface phenotypes of hADSCs. (B) The quantitative results of the flow cytometry analysis. (C) The adipogenic and osteogenic differentiation of hADSCs. (a) Negative control and (b) positive group for adipogenic differentiation. (c) Negative control and (d) positive group for osteogenic differentiation. (D) PAC1R expression in hADSCs based on RT‐PCR analysis. (E) PAC1R expression in hADSCs based on Western blot assay. (F) PAC1R expression in hADSCs based on immunofluorescence assays.
