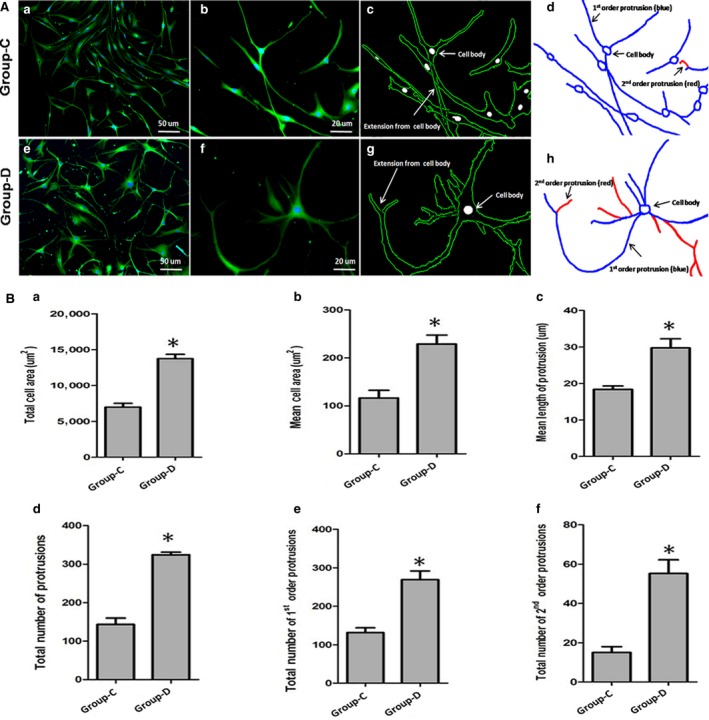
Figure 6.

Morphological analysis of the effects of maxadilan on the chemical neural induction of hADSCs. (Aa, Ab, Ae, Af) Fluorescent images indicating cell contour in group‐C and group‐D. (Ac, Ad, Ag, Ah) The cell morphology was acquired from fluorescent images by MATLAB software, which identified the cellular contour (Ac and Ag) and cellular skeleton (Ad and Ah) in both groups. (B) Based on the cellular contour and skeleton, the dependence of cell morphologies was examined, including total cell areas (Ba), mean cell areas (Bb), the mean protrusion length (Bc), the total number of protrusions (Bd), 1st order protrusion numbers (Be), and 2nd order protrusion numbers (Bf) in two groups. Differences with *P < 0.05 (group‐C versus group‐D) were considered significant.
