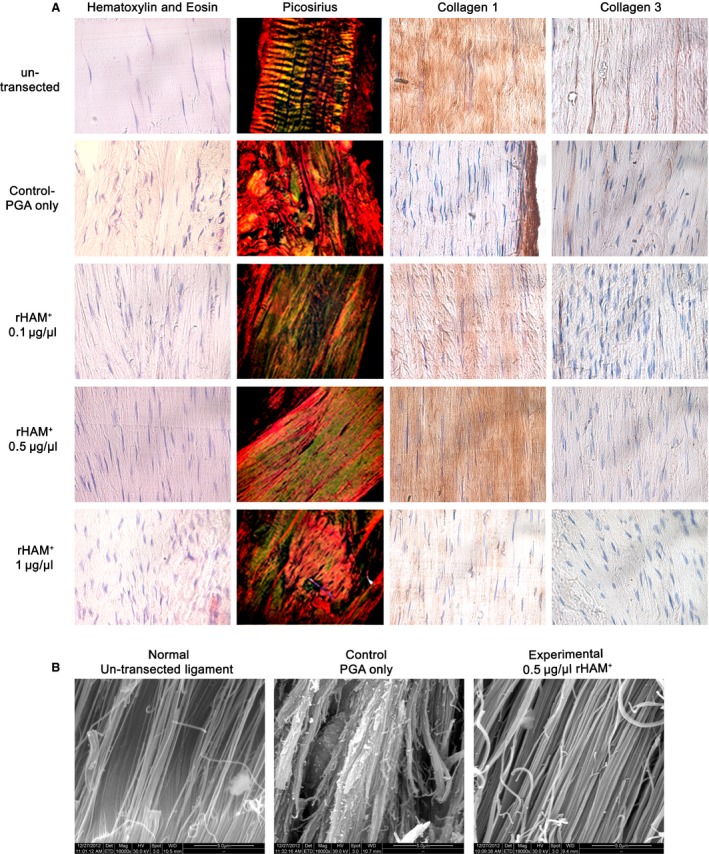
Figure 2.

Morphometric and composition analyses of the transected area 12 weeks after operation. (A) Haematoxylin and eosin staining, picrosirius red staining and immunohistochemistry using collagen I and III antibodies (brown staining) of un‐transected ligaments, transected area of experimental ligaments treated with 0.1, 0.5, 1 μg/μl rHAM + dissolved in PGA, and transected area of control ligaments treated with PGA carrier alone. (B) Scanning electron microscope pictures of ligaments 12 weeks after operation: left ‐ un‐transected ligament, middle – transection zone of a ligament treated with PGA carrier (control), right – transection zone of a ligament treated with 0.5 μg/μl rHAM + dissolved in PGA (experimental), magnification ×16,000.
