
Figure 2.
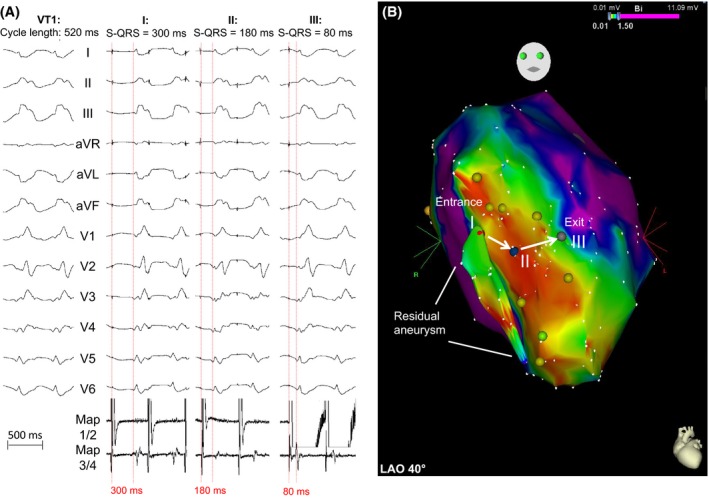
Pacemapping of VT1 (CL = 520 msec, right bundle branch block, inferior axis). (A) Pacemapping with continuous reduction in stimulus‐QRS intervals. Points (I: red, II: blue, III: gray) represent the corresponding locations within the electroanatomical map (B). Entrance and exit site are presented (white arrows). A small residual aneurysm was found during mapping of the left ventricle (white lines).