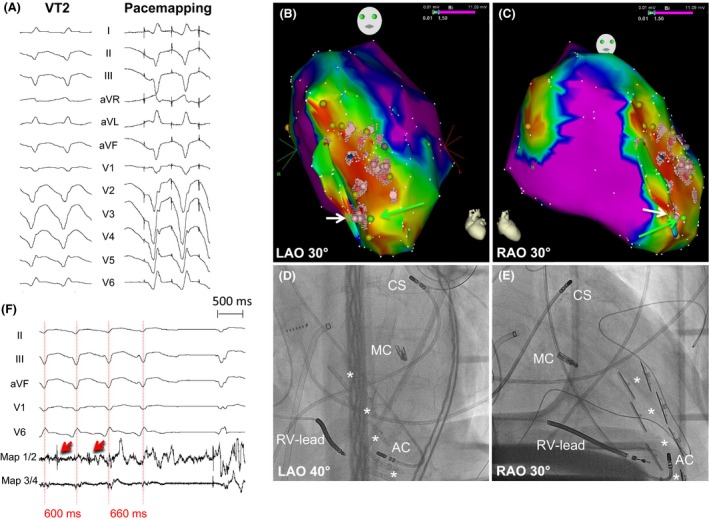
Figure 4.

Pacemapping and Ablation of VT2 (CL = 600 msec, right bundle branch block, superior axis). (A) Pacemapping of VT2, (B, C) Electroanatomical maps. Light red points and the white arrow mark the ablation sight. (D, E) Corresponding angiographic images presenting the sight of ablation (retrograde transaortic approach). AC, Ablation Catheter; CS, Coronary Sinus catheter; MC, MitraClip™; RV‐Lead, Right Ventricular‐lead of ICD. The white stars mark the pairs of Revivent‐TC ™ anchors. (F) Prolongation and termination of VT2 during ablation. Red arrows presenting middiastolic potentials.
