
Figure 2.
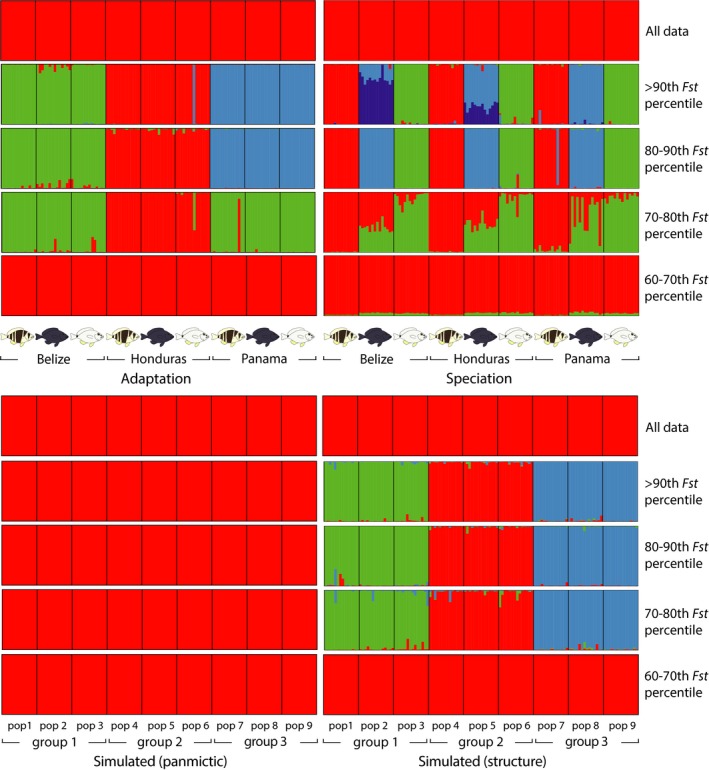
Clustering results for adaptation (among populations, Belize, Honduras, and Panama), speciation (among species, Hypoplectrus puella, H. nigricans, and H. unicolor, from Puebla et al. 2014), and simulated data (panmictic, migration rate m = 0.5, and structure, migration rate m = 0.02). In each case, the entire dataset (~40,000 SNPs) is presented above, followed by the SNPs above the 90th F st percentile, between the 80th and 90th F st percentiles, between the 70th and 80th F st percentiles, and between the 60th and 70th F st percentiles (~8000 SNPs in each case). Details in Figure S1.