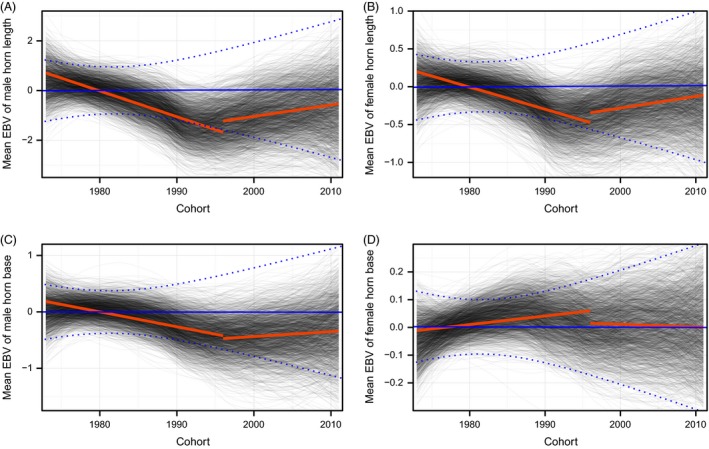
Figure 2.

Changes in mean estimated breeding values (EBV) for bighorn sheep cohorts born at Ram Mountain between 1973 and 2011, according to a multivariate model. Panels present the EBV of (A, B) horn length and (C, D) horn base in cm. The left column shows results for males and the right column for females. Each grey line represents the average estimated breeding value through time for one iteration of the MCMC chain of the animal model using loess. Red lines represent the posterior mean trend using linear regression for the hunted and non‐hunted period. The blue line represents the average response expected by drift alone, with 95% confidence interval in dashed blue lines.
