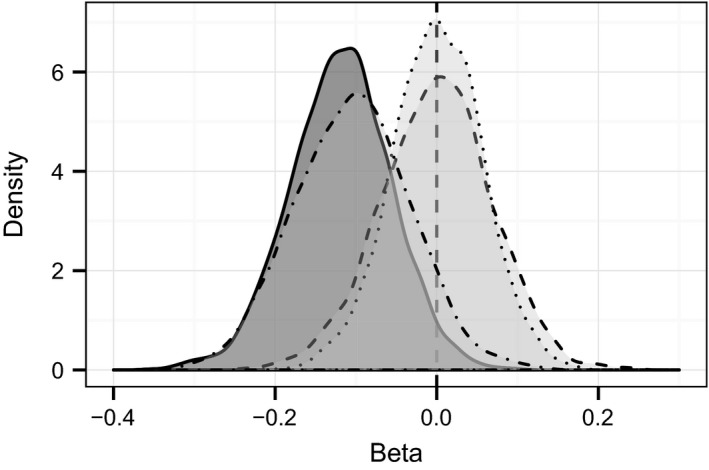
Figure 3.

Posterior density plots for the slopes in mean estimated breeding values of male horn length and predicted change in estimated breeding value according to different models of evolutionary change for bighorn sheep cohorts born at Ram Mountain from 1973 to 1996. The dark filled distribution with solid line represents the posterior distribution of slopes in mean cohort breeding values (ße) for male horn length. The distribution with dot‐dashed line represents predicted annual evolutionary response according to the secondary theorem of selection. The distribution with dotted line represents predicted change according to simulation of stasis. The distribution with dashed line represents predicted changes due to drift according to simulation of random breeding values.
