
Figure 1.
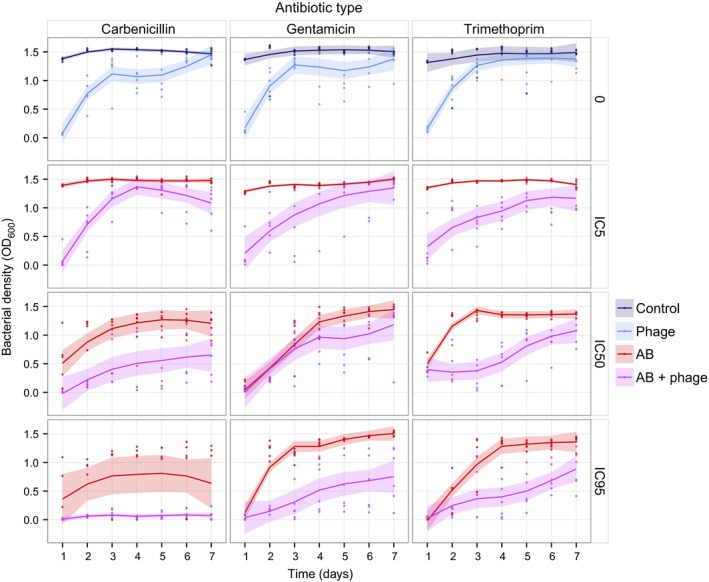
Bacterial density dynamics measured every 24 h for 7 days. The horizontal panels represent the different concentrations of antibiotics relative to the resulting % inhibition of growth (IC: inhibitory concentration), and the vertical panels represent the different antibiotic types used. ‘Control’ corresponds to untreated bacteria, ‘phage’ to phage only, ‘AB’ to antibiotic only, and ‘AB + phage’ to combined phage and antibiotic treatments. Solid lines represent the means of eight populations. Shaded regions are 95% confidence intervals.