
Figure 4.
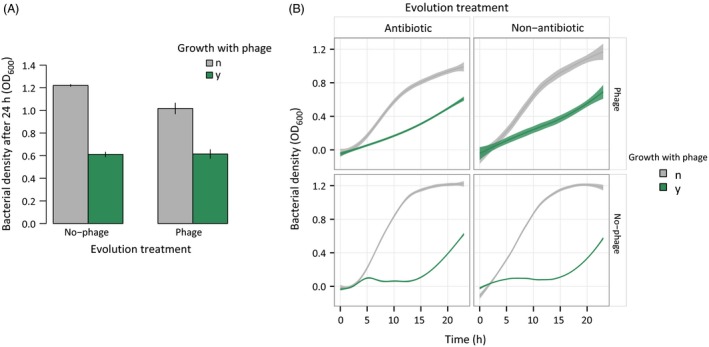
Effects of reintroducing ancestral phage into final bacterial populations. Panel (A) represents the final OD attained by bacteria in 24 h depending on if they were evolved with or without phages (x‐axis). The legend indicates re‐exposure or not to the ancestral phage (green and gray, respectively). Bars are standard errors. Panel (B) shows the OD values over 24 h used to determine the AUC (area under the curve) in the presence or absence of ancestral phage (green and gray, respectively). The different vertical panels represent treatments of bacteria evolved with antibiotics or not. Horizontal panels divide treatments where phage was or was not introduced as a treatment. Antibiotic types and doses were grouped. Shaded regions are 95% confidence intervals.