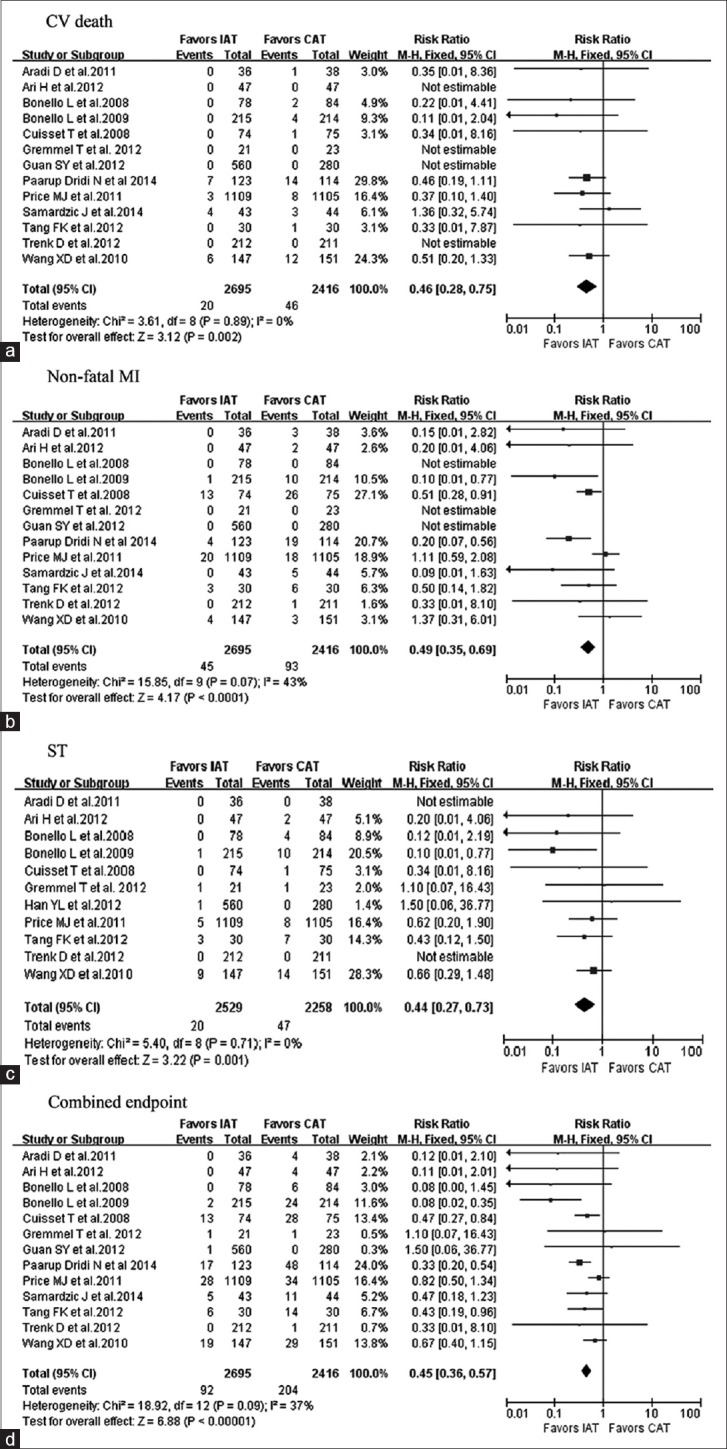
Figure 2.

Forest plots for the effect of IAT versus CAT. (a-d) Represent for CV death, nonfatal MI, ST, and the combined endpoints, respectively. IAT: Intensified antiplatelet treatment; CAT: Conventional antiplatelet treatment; CV: Cardiovascular; MI: Myocardial infarction; ST: Stent thrombosis; CI: Confidence interval.
