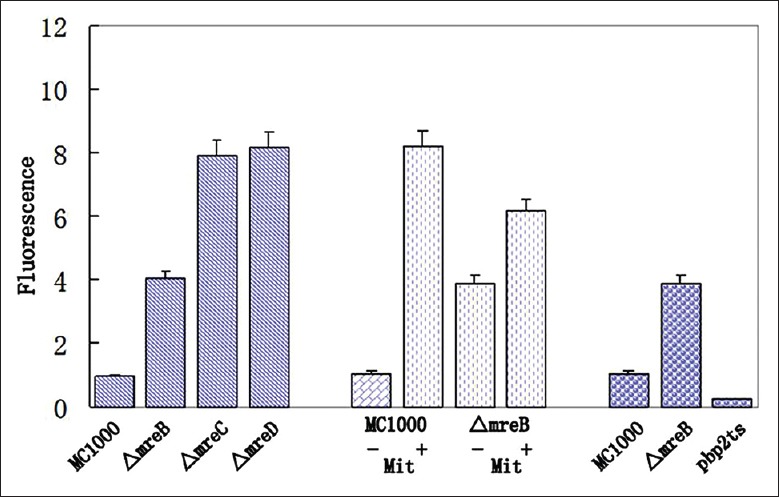
Figure 3.

SOS induction in ΔmreB, ΔmreC, ΔmreD, and pbp2Ts strains. SOS induction was monitored as gfp fluorescence from PsulA-gfp. Fluorescence intensity is expressed relative to fluorescence of the wild-type parental strain MC1000 in the same experiment. The error bars indicate standard deviation (n = 5). In column 5–8, 1.5 μmol/L mitomycin (Mit) was either absent (−, column 5, 7) or present (+, column 6, 8). Columns 9–11 represent experiments conducted at 42°C.
