
Figure 2 and 3.
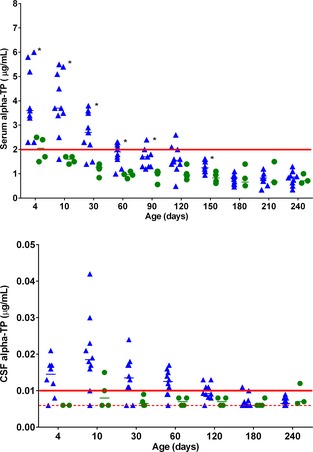
Individual scatter plot and of serum (Fig. 2) and cerebrospinal fluid (CSF; Fig. 3) alpha‐tocopherol (α‐TP) concentrations in foals during the first 240 days of life. Data for healthy supplemented (CON‐SUP) and healthy unsupplemented (CON‐UNSUP) were combined (blue triangles, n = 10). Foals that developed neuroaxonal dystrophy/equine degenerative myeloencephalopathy (NAD/EDM) are represented in green circles (n = 4). Median values are denoted by a horizontal bar. Normal reference ranges are denoted by the red solid line. The red hatched line represents the limit of detection of the CSF assay (0.07 μg/mL). The level of *P adj < .05 is based on a Bonferroni‐adjusted t‐test (CON versus NAD/EDM).