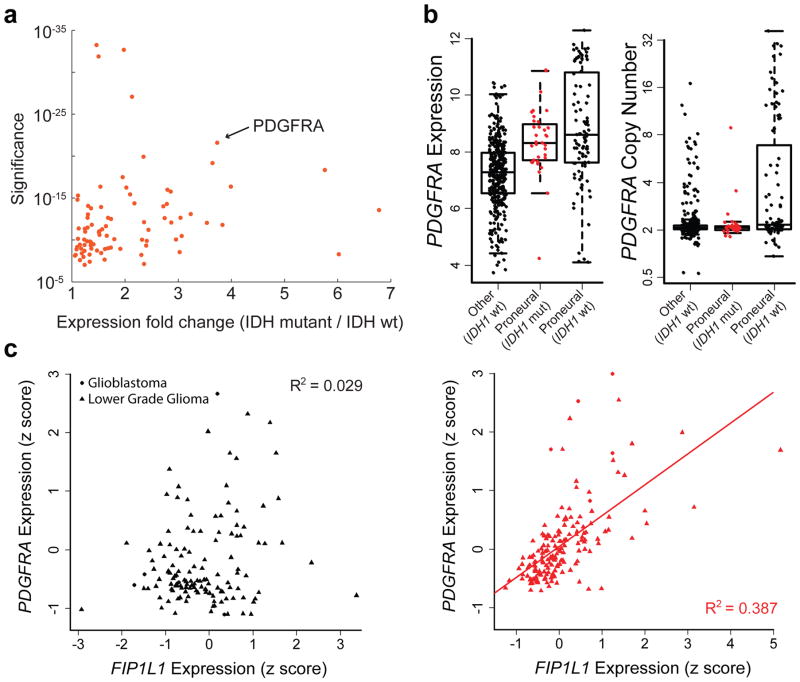
Figure 2. Topological domain boundaries disrupted in IDH1 mutant gliomas.
(a) Scatterplot depicts significance of deregulated boundaries in IDH mutant tumors (y-axis) against fold-change of most up-regulated gene in adjacent domains (x-axis). PDGFRA is adjacent to a significantly deregulated boundary and up-regulated in IDH mutants. (b) Boxplots compare PDGFRA expression (left) or copy number (right) for 443 glioblastoma tumors, classified by IDH status and expression subtype24. IDH mutants (red) have elevated PDGFRA expression, despite normal copy number. (c) Plots compare PDGFRA (y-axis) and FIP1L1 (x-axis) expression in IDH wildtype (left) and mutant (right) gliomas. The genes correlate specifically in IDH mutants, consistent with deregulation of the intervening boundary/insulator.

