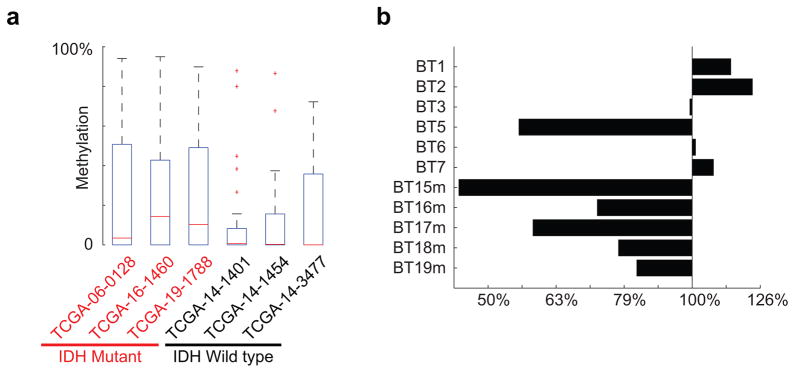
Extended Data Figure 1. DNA methylation and CTCF binding at deregulated boundaries.
(a) Box plots show DNA methylation levels over CTCF sites (200 bp window centered on the peak) within boundaries predicted by gene pair correlation analysis to be disrupted. All CTCF sites located within a 1 kb window centered on a disrupted boundary were considered. Methylation levels were determined from whole genome bisulfite data for three IDH mutant (red labels) and three IDH wildtype (black labels) tumors. (b) Bars show average normalized ChIP-seq signal over all CTCF sites located inside a 1 kb window centered on a disrupted boundary.

