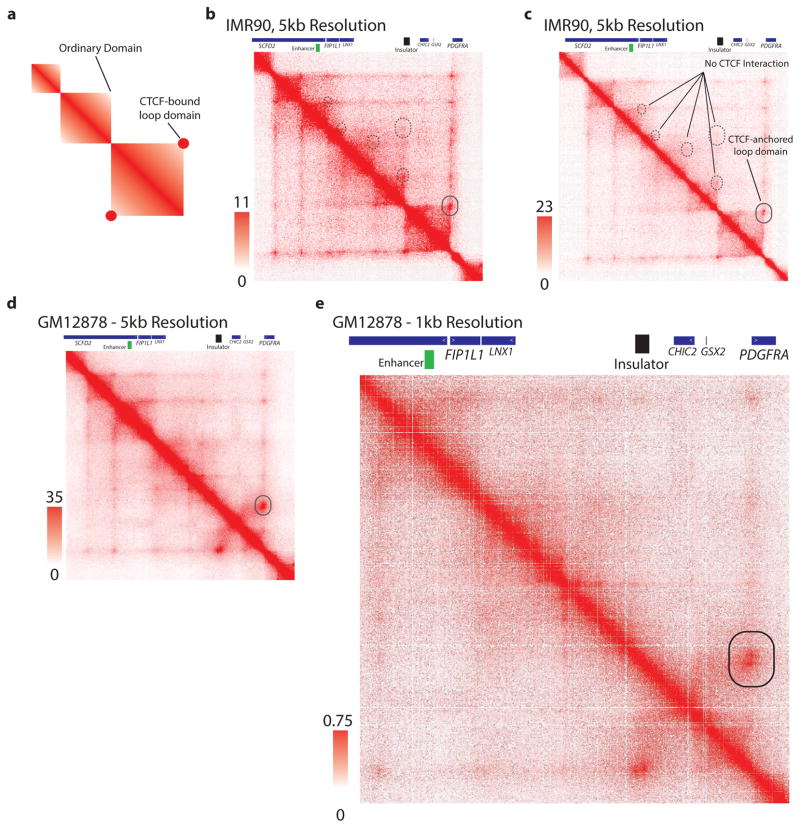
Extended Data Figure 3. CTCF anchored loop in the PDGFRA region.
(a) Schematic depiction of a HiC interaction signature of a CTCF-anchored loop domain, compared to an ordinary domain, as described by Rao et al., Cell 2014. CTCF-anchored loop domains are characterized by an increased interaction score at the apex of the domain, representing a CTCF-CTCF dimeric interaction. (b) IMR90 HiC contact matrix for the PDGFRA/FIP1L1 locus, as presented in Figure 3a. Solid circle indicates CTCF dimer interaction point. Dashed circles indicate lack of CTCF dimeric anchor signature. (c) IMR90 HiC contact matrix as in (b), but with expanded heatmap scale, more clearly conveys the CTCF-anchored loop that insulates PDGFRA. (d,e) HiC contact matrix for GM12878 cells for the same region confirms a single CTCF-anchored loop (solid circle) between PDGFRA and FIP1L1. These data support the significance of this specific boundary in locus topology and PDGFRA insulation.

