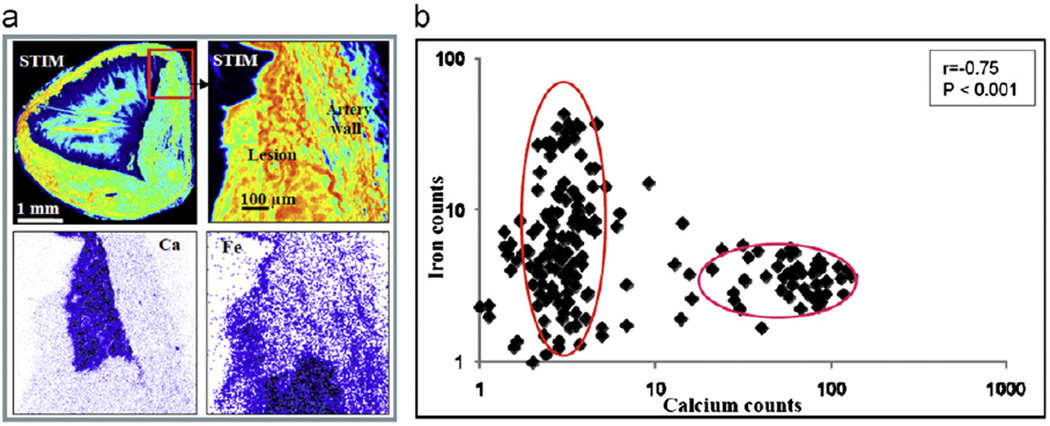
Fig. 4.
(a) Clockwise from top left—STIM image of the whole artery section as shown in Fig. 1c, STIM image, and iron map and calcium map from the area depicted by the red box. (b) Scatter plot showing calcium and iron PIXE characteristic X-ray counts. The counts are calculated by dividing the scanned region into 16 × 16 pixels and plotting the Ca count against the Fe count for each pixel (note the log plot). The pixels containing high calcium correspond to the pixels containing low iron.

