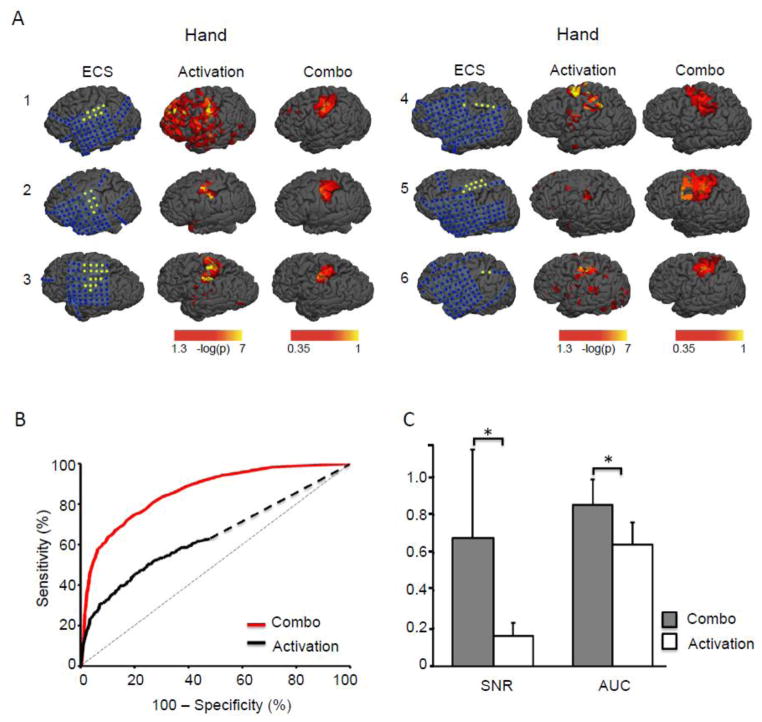
Figure 5.
Replication of combo mapping benefit in an independent dataset consisting of 6 patients. Electrical cortical stimulation (ECS), task activation, and combination mapping results are shown for each patient in DATASET 2 (A). The blue dots in the ECS maps indicate negative electrodes (no symptoms related to sensory motor cortex reported when stimulated) while the yellow dots indicate positive electrodes. Group-level receiver operating characteristic (ROC) curves (B), signal to noise ratio (C, SNR) and area under the ROC curve (C, AUC) were plotted and compared between the combo mapping approach and traditional task activation mapping. * p < 0.01

