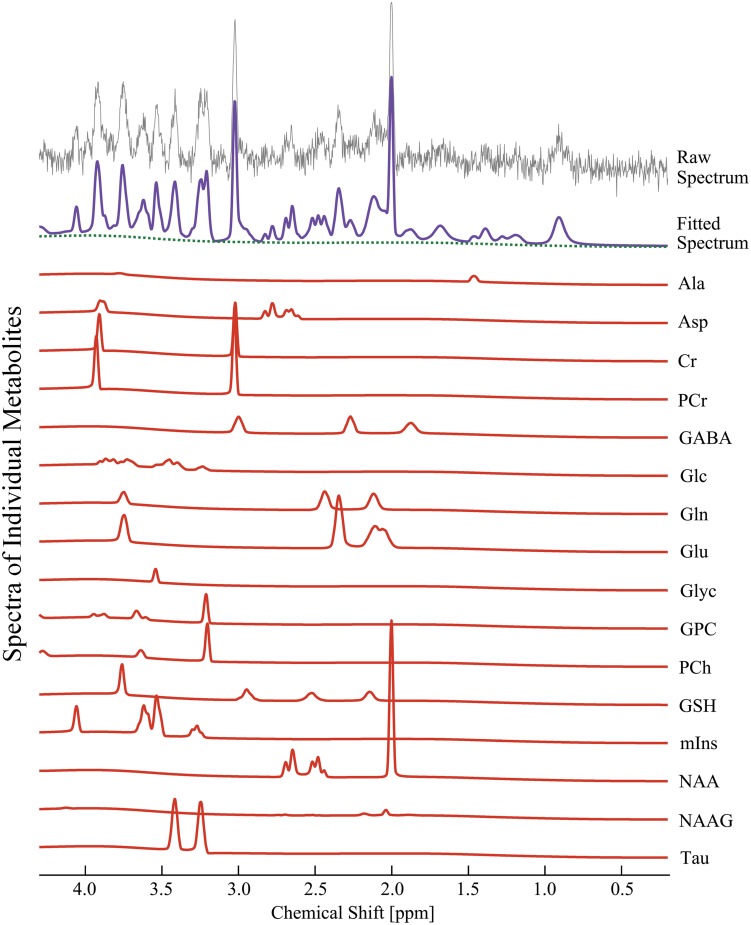
Fig 2. Quantification of 16 neuro-metabolite signals from in vivo 1H MRS in the right dorsal hippocampal region of the SSP model.
The illustrations completely discriminated the raw spectrum (grey), fitted spectrum (purple), baseline (dotted green), and each neuro-metabolite signal (solid red) from the obtained in vivo 1H spectrum at 9.4 T. SSP: stress-induced sleep perturbation.

