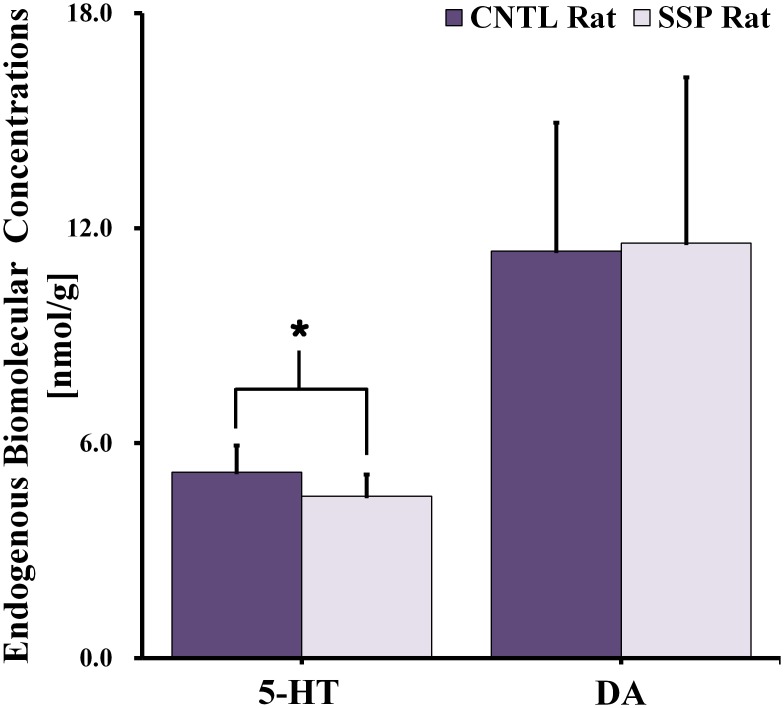
Fig 5. Endogenous biomolecule signals in the right dorsal hippocampal region of control and SSP rats, as quantified using LC-MS/MS.
The concentrations in each signal are expressed as nanomole per gram (nmol/g). Results were considered significant when independent t-tests revealed *p < 0.05. The vertical lines on each of the bars indicate the (+) standard deviation from the mean values of the endogenous biomolecule signals. SSP: stress-induced sleep perturbation; LC-MS/MS: liquid chromatography-tandem mass spectrometry.

