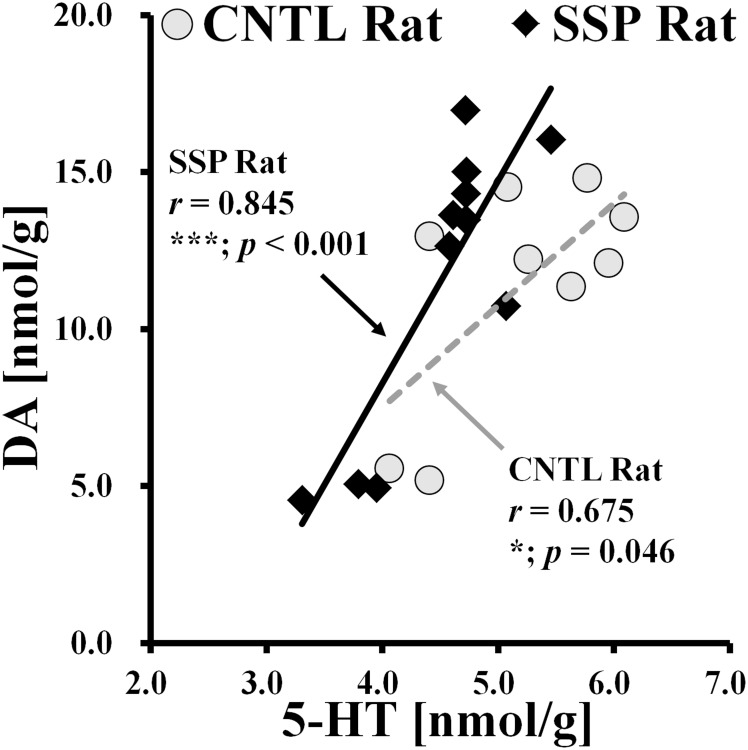
Fig 6. Scatter plots of signals obtained from endogenous biomolecules are quantified using data from individual rats.
CNTL rats are represented with gray circles, while SSP rats are represented with black rhombi. Pearson correlation coefficients for individual clusters are represented as follows: CNTL (dotted line, gray) and SSP (solid line, black). The illustrations show the positive correlations of dopamine and serotonin concentrations between CNTL and SSP rats. The significance levels of the p values are as follows: *p < 0.05; ***p < 0.001. DA: dopamine; 5-HT: 5-hydroxytryptamine (serotonin).

