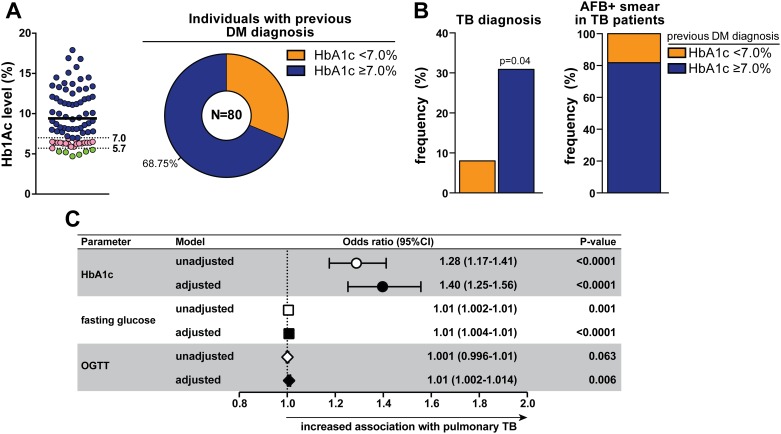
Fig 3. Worse glycemic control is associated with pulmonary TB.
(A) Left panel shows Hb1Ac levels in individuals who self reported previous diagnosis of diabetes. Full line represents median value (Hb1Ac = 8.45%). Dotted lines represent thresholds of Hb1Ac used to define normoglycemic levels (5.7%) and uncontrolled DM (7.0%) according to the ADA criteria [18]. Right panel shows frequency of individuals with respiratory symptoms who had referred previous diagnosis of diabetes and presented with poor glycemic control (HbA1c ≥ 7.0%). (B) Frequency of TB diagnosis (left panel) in patients referring previous DM diagnosis, with or without HbA1c ≥ 7.0%. Right panel shows frequency of TB cases with AFB+ sputum smears. The Fisher's exact test was used to assess statistical significance. (C) Linear regression analysis adjusted for age, gender and BMI was used to determine the association between increases of 1 unit in plasma values of HbA1c, fasting glucose or OGTT glycaemia (after log10 transformation) and pulmonary TB in the entire study population (n = 892). The odds associated with the covariates used in the model adjustment are displayed in S1 Table.

