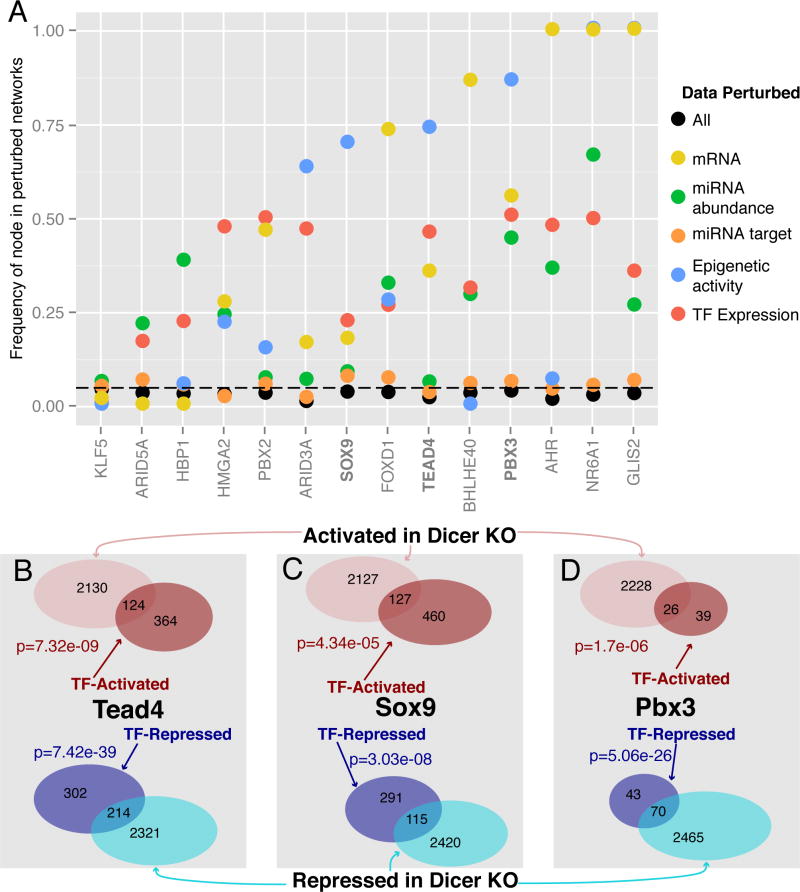
Fig. 6.
Computational and experimental validation of selected transcriptional factors. (A) Results of computational network perturbation indicating how frequently the algorithm-selected transcription factors showed up when either individual (colored) data sources were perturbed or all (black) data sources were perturbed. (B–D) Genes with significant (q<0.05) changes in intronic RNA levels that are activated (red) and repressed (blue) upon over-expression of (B) Flag-HA-Tead4, (C) Flag-HA-Sox9, and (D) Flag-HA-Pbx3 are significantly enriched in genes with intronic log2 RNA changes > 0.5 (pink) or less than −0.5 (cyan) in the Dicer KO. P-values computed via Fisher’s exact test.

