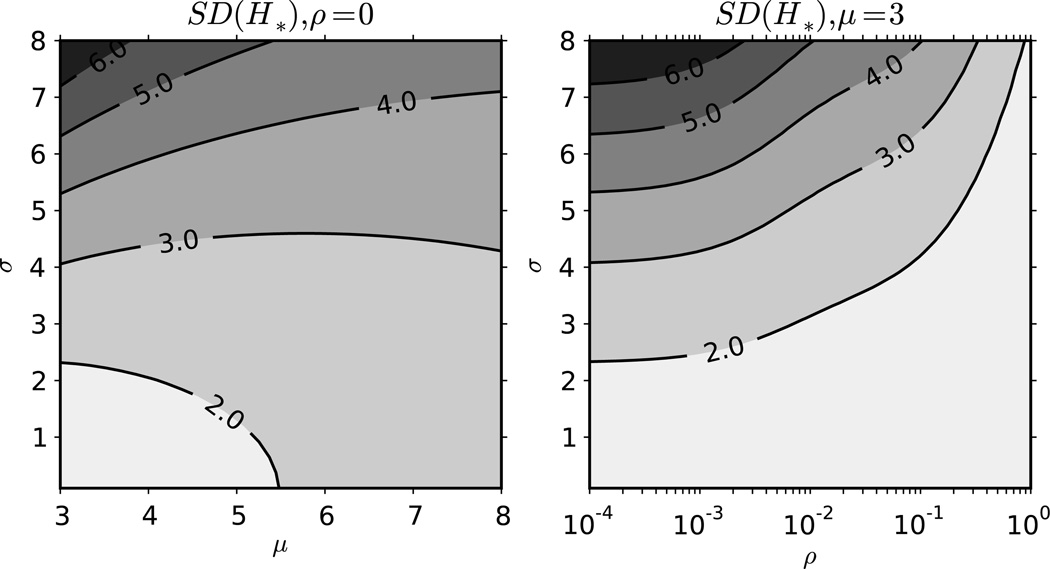
Figure 3.
Effect of contract rate volatility on SD(H*). This plot shows the effect of the mean (x-axis) and standard deviation (y-axis) of the contact rate distribution on the standard deviation of the number of transmissions generated by an index case, SD(H*), without contact rate volatility (left panel). The panel on the right shows the effect of the standard deviation of contact rates (y-axis) and the degree of contact rate volatility (x-axis). The average duration of a behavioral interval is ρ−1 such that low values of ρ mean essentially static contact rates. The average duration of infection is 148 months with the first 2 months being the first stage and the remainder in the second. The probabilities of infection given contact are 0.05 and 0.001 in the first and second stages respectively.

